|
NSJ Bioreagents
mouse anti trem2 monoclonal antibody Mouse Anti Trem2 Monoclonal Antibody, supplied by NSJ Bioreagents, used in various techniques. Bioz Stars score: 94/100, based on 1 PubMed citations. ZERO BIAS - scores, article reviews, protocol conditions and more https://www.bioz.com/result/mouse anti trem2 monoclonal antibody/product/NSJ Bioreagents Average 94 stars, based on 1 article reviews
mouse anti trem2 monoclonal antibody - by Bioz Stars,
2026-03
94/100 stars
|
Buy from Supplier |
|
R&D Systems
anti trem2 Anti Trem2, supplied by R&D Systems, used in various techniques. Bioz Stars score: 93/100, based on 1 PubMed citations. ZERO BIAS - scores, article reviews, protocol conditions and more https://www.bioz.com/result/anti trem2/product/R&D Systems Average 93 stars, based on 1 article reviews
anti trem2 - by Bioz Stars,
2026-03
93/100 stars
|
Buy from Supplier |
|
Santa Cruz Biotechnology
mouse anti trem2 Mouse Anti Trem2, supplied by Santa Cruz Biotechnology, used in various techniques. Bioz Stars score: 93/100, based on 1 PubMed citations. ZERO BIAS - scores, article reviews, protocol conditions and more https://www.bioz.com/result/mouse anti trem2/product/Santa Cruz Biotechnology Average 93 stars, based on 1 article reviews
mouse anti trem2 - by Bioz Stars,
2026-03
93/100 stars
|
Buy from Supplier |
|
R&D Systems
af1828 Af1828, supplied by R&D Systems, used in various techniques. Bioz Stars score: 90/100, based on 1 PubMed citations. ZERO BIAS - scores, article reviews, protocol conditions and more https://www.bioz.com/result/af1828/product/R&D Systems Average 90 stars, based on 1 article reviews
af1828 - by Bioz Stars,
2026-03
90/100 stars
|
Buy from Supplier |
|
Proteintech
rabbit anti trem2 Rabbit Anti Trem2, supplied by Proteintech, used in various techniques. Bioz Stars score: 95/100, based on 1 PubMed citations. ZERO BIAS - scores, article reviews, protocol conditions and more https://www.bioz.com/result/rabbit anti trem2/product/Proteintech Average 95 stars, based on 1 article reviews
rabbit anti trem2 - by Bioz Stars,
2026-03
95/100 stars
|
Buy from Supplier |
|
Cell Signaling Technology Inc
rabbit monoclonal anti mouse trem2  Rabbit Monoclonal Anti Mouse Trem2, supplied by Cell Signaling Technology Inc, used in various techniques. Bioz Stars score: 94/100, based on 1 PubMed citations. ZERO BIAS - scores, article reviews, protocol conditions and more https://www.bioz.com/result/rabbit monoclonal anti mouse trem2/product/Cell Signaling Technology Inc Average 94 stars, based on 1 article reviews
rabbit monoclonal anti mouse trem2 - by Bioz Stars,
2026-03
94/100 stars
|
Buy from Supplier |
|
R&D Systems
mouse monoclonal anti mouse trem2  Mouse Monoclonal Anti Mouse Trem2, supplied by R&D Systems, used in various techniques. Bioz Stars score: 93/100, based on 1 PubMed citations. ZERO BIAS - scores, article reviews, protocol conditions and more https://www.bioz.com/result/mouse monoclonal anti mouse trem2/product/R&D Systems Average 93 stars, based on 1 article reviews
mouse monoclonal anti mouse trem2 - by Bioz Stars,
2026-03
93/100 stars
|
Buy from Supplier |
|
R&D Systems
anti humantrem2 polyclonal capture antibody Anti Humantrem2 Polyclonal Capture Antibody, supplied by R&D Systems, used in various techniques. Bioz Stars score: 95/100, based on 1 PubMed citations. ZERO BIAS - scores, article reviews, protocol conditions and more https://www.bioz.com/result/anti humantrem2 polyclonal capture antibody/product/R&D Systems Average 95 stars, based on 1 article reviews
anti humantrem2 polyclonal capture antibody - by Bioz Stars,
2026-03
95/100 stars
|
Buy from Supplier |
|
R&D Systems
biotinylated goat anti human trem2 Biotinylated Goat Anti Human Trem2, supplied by R&D Systems, used in various techniques. Bioz Stars score: 95/100, based on 1 PubMed citations. ZERO BIAS - scores, article reviews, protocol conditions and more https://www.bioz.com/result/biotinylated goat anti human trem2/product/R&D Systems Average 95 stars, based on 1 article reviews
biotinylated goat anti human trem2 - by Bioz Stars,
2026-03
95/100 stars
|
Buy from Supplier |
|
Cell Signaling Technology Inc
sheep anti trem2  Sheep Anti Trem2, supplied by Cell Signaling Technology Inc, used in various techniques. Bioz Stars score: 94/100, based on 1 PubMed citations. ZERO BIAS - scores, article reviews, protocol conditions and more https://www.bioz.com/result/sheep anti trem2/product/Cell Signaling Technology Inc Average 94 stars, based on 1 article reviews
sheep anti trem2 - by Bioz Stars,
2026-03
94/100 stars
|
Buy from Supplier |
|
R&D Systems
anti mouse trem2 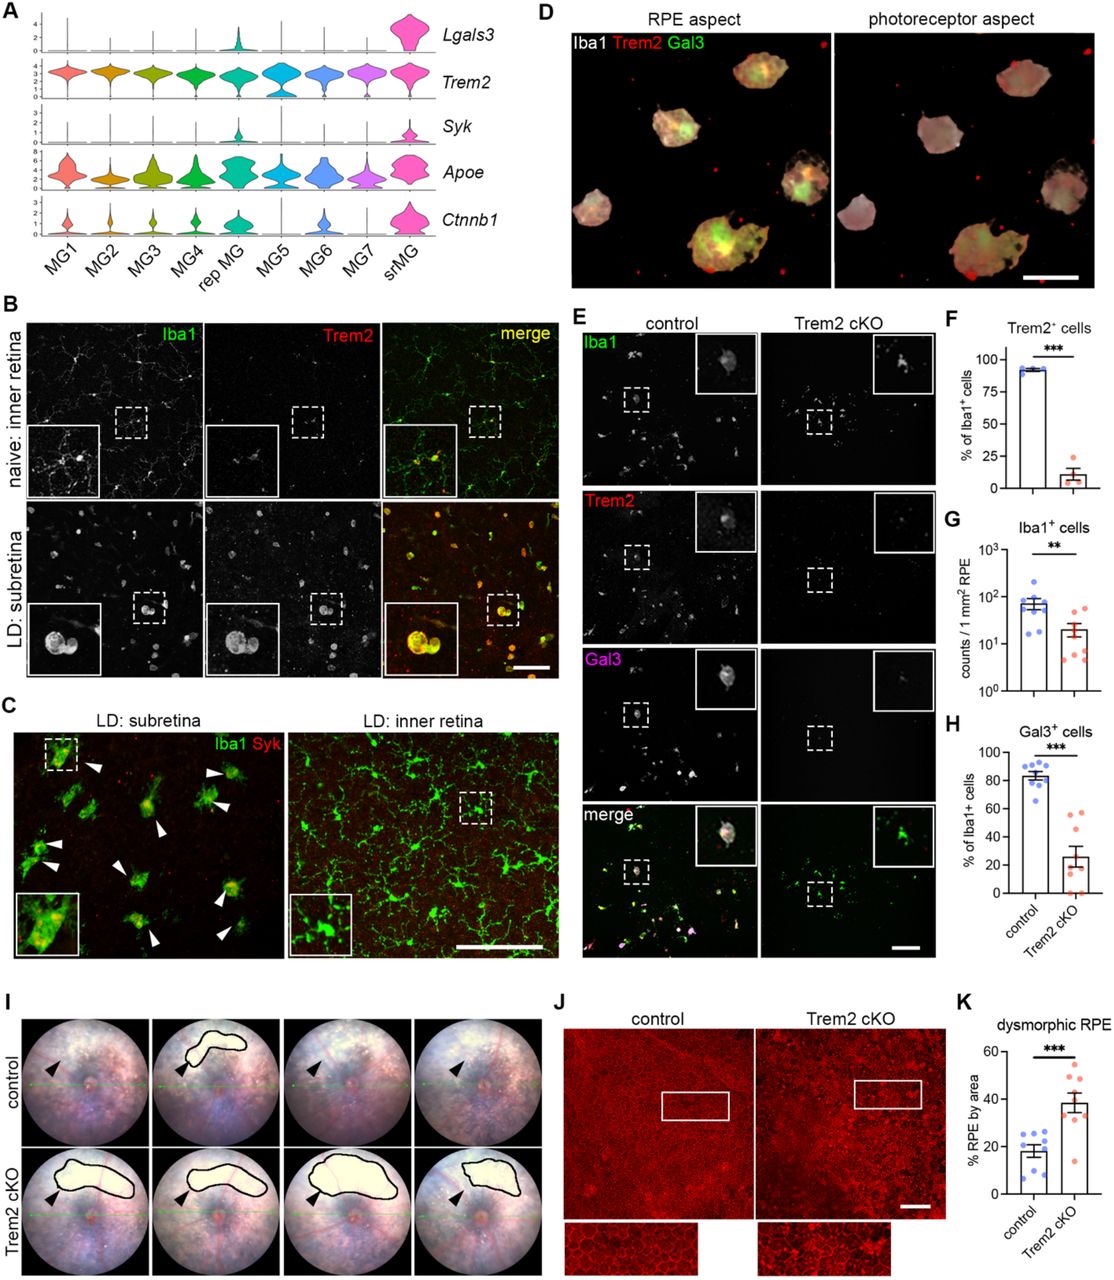 Anti Mouse Trem2, supplied by R&D Systems, used in various techniques. Bioz Stars score: 94/100, based on 1 PubMed citations. ZERO BIAS - scores, article reviews, protocol conditions and more https://www.bioz.com/result/anti mouse trem2/product/R&D Systems Average 94 stars, based on 1 article reviews
anti mouse trem2 - by Bioz Stars,
2026-03
94/100 stars
|
Buy from Supplier |
|
R&D Systems
mouse anti trem2 2b5 Mouse Anti Trem2 2b5, supplied by R&D Systems, used in various techniques. Bioz Stars score: 95/100, based on 1 PubMed citations. ZERO BIAS - scores, article reviews, protocol conditions and more https://www.bioz.com/result/mouse anti trem2 2b5/product/R&D Systems Average 95 stars, based on 1 article reviews
mouse anti trem2 2b5 - by Bioz Stars,
2026-03
95/100 stars
|
Buy from Supplier |
Image Search Results
Journal: EMBO Reports
Article Title: Functional BRI2-TREM2 interactions in microglia: implications for Alzheimer’s and related dementias
doi: 10.1038/s44319-024-00077-x
Figure Lengend Snippet: ( A ) UMAP visualization of mouse hippocampal cell clusters classified by cell type based on DEG identified by Seurat v4. Violin plots represent the log-normalized expression of Itm2b and Trem2 across cell populations in mouse hippocampal cell clusters. ( B ) Human DFC cell clusters, classified by cell type as in ( A ). Violin plots represent the log-normalized expression of ITM2B and TREM2 across cell populations in human DFC cell clusters. ( C ) List of cell-type- specific marker genes used to annotate major brain populations. ( D ) Itm2b and Trem2 mRNA expression in mouse microglia and non-microglia cells analyzed by quantitative RT-PCR. Data information: The data sets analyzed are publicly available and are described in the two following papers: mouse scRNAseq data set (Zeisel et al, ), hippocampus n = 5 females, n = 5 males; human snRNAseq data set (Li et al, ), n = 10 (sex not specified). More information about these datasets can be found in the cited paper. Statistical comparisons between the groups shown in ( D ) was conducted using two-tailed unpaired t test **** P < 0.0001. The data are derived from are from 15-month-old w/w control animal, male n = 3, females n = 3; the letter “n” indicates biological replicates. All data are expressed as means +/− SEM. .
Article Snippet: The plates were washed three times with PBST and incubated with either 1 μg/ml of
Techniques: Expressing, Marker, Quantitative RT-PCR, Two Tailed Test, Derivative Assay, Control

Journal: EMBO Reports
Article Title: Functional BRI2-TREM2 interactions in microglia: implications for Alzheimer’s and related dementias
doi: 10.1038/s44319-024-00077-x
Figure Lengend Snippet: ( A ) UMAPs of objects Data 1 and Data 2 before filtering. ( B ) UMAPs of objects Data 1 and Data 2 after filtering. ( C ) UMAP of Object 1 after integration, filtering, and re-clustering, shows 16 microglia clusters. Data information: The data presented in this analysis are the result of two experiments, namely Data 1 and Data 2. To combine specific sample datasets from both Data 1 and Data 2, we employed the integration feature within the Seurat package. By utilizing the first 20 principal components, we integrated these datasets into a single entity referred to as “Object1,” which encapsulates information from a total of 297,215 cells. These cells derive from: Trem2-KO , 1 male and 1 female; Itm2b-KO , 2 males and 2 females; WT controls, 1 male and 2 females; Itm2b/Trem2-dKO , 1 male and 1 female. The scRNAseq data are deposited at https://www.ncbi.nlm.nih.gov/geo/info/seq.html , GSE233601 to allow public access once the data are published.
Article Snippet: The plates were washed three times with PBST and incubated with either 1 μg/ml of
Techniques:

Journal: EMBO Reports
Article Title: Functional BRI2-TREM2 interactions in microglia: implications for Alzheimer’s and related dementias
doi: 10.1038/s44319-024-00077-x
Figure Lengend Snippet: ( A ) UMAPs of microglia grouped by genotype. ( B ) Average scaled expression levels of selected signature genes per cluster and cluster’s annotation based on expression of signature genes. ( C ) Volcano plots showing differentially expressed genes in clusters I/T-D1, 2, 3 and 4. ( D ) Proportional contribution of each genotype and proportional contribution of individual samples of each genotype to cluster 3. ( E ) KEGG pathway enrichment analysis of pathways upregulated in cluster 3. Data information: The data presented in this analysis are the result of two experiments, namely Data 1 and Data 2. To combine specific sample datasets from both Data 1 and Data 2, we employed the integration feature within the Seurat package. By utilizing the first 20 principal components, we integrated these datasets into a single entity referred to as “Object1,” which encapsulates information from a total of 297,215 cells. Volcano plots in ( C ) were obtained using Fast Wilcoxon rank sum test and auROC. These cells derive from: Trem2-KO , n = 1 male and n = 1 female; Itm2b-KO , n = 2 males and n = 2 females; WT controls, n = 1 male and n = 2 females; Itm2b/Trem2-dKO , n = 1 male and n = 1 female. The scRNAseq data are deposited at https://www.ncbi.nlm.nih.gov/geo/info/seq.html , GSE233601 to allow public access once the data are published. All data are expressed as means +/− SEM.
Article Snippet: The plates were washed three times with PBST and incubated with either 1 μg/ml of
Techniques: Expressing

Journal: EMBO Reports
Article Title: Functional BRI2-TREM2 interactions in microglia: implications for Alzheimer’s and related dementias
doi: 10.1038/s44319-024-00077-x
Figure Lengend Snippet: ( A ) N2A or HEK293 cells were transfected with F-BRI2 (B) and Trem2 (T), either alone (V=empty pcDNA3.1vector) or in combination and analyzed by Western blot with anti-FLAG (M2) and anti-Trem2 (NT1) on total lysates (T.L.) and M2 immunoprecipitants (IP-M2). Immunoprecipitants bound to M2-Agarose beads were specifically eluted using the 3xFLAG peptide. For each cell line, two independent transfections were performed (Exp. 1 and Exp. 2). ( B ) Schematic representation of Trem2 and the two products of α-secretase cleavage, sTrem2, and Trem2-CTF. TM indicates the transmembrane region of Trem2. Red bars point to the antigenic regions used to produce the anti-Trem2 antibodies CT, NT1 and NT2. The cytosolic and intralumenal/extracellular regions of Trem2 are indicated. ( C ) Western blot analysis with anti-FLAG, anti-Trem2 NT1, and anti-Trem2 CT antibodies of T.L. and IP-M2 from HEK293 cells transfected with F-BRI2 and Trem2, either alone or in combination, with or without deglycosylation. *Indicates Trem2 species of unclear primary structure. Trem2 (f.l.) indicates full length Trem2. ( D ) Western blot analysis with anti-FLAG and anti-Trem2 CT antibodies of immunoprecipitants obtained with CT, NT1, and NT2 antibodies from HEK293 cells expressing either F-BRI2 alone or F-BRI2 plus Trem2. The nature of the bands migrating above 100 kDa in the NT2 IP samples is unknow. ( E ) Schematic representation of the F-BRI2 constructs used in ( F ). The Bri23 region, transmembrane region (TM), Brichos domain, APP-binding domain (APP BD), FLAG tag (F), cytosolic and intralumenal/extracellular regions are indicated. ( F ) WB analysis with anti-FLAG and anti-Trem2 antibodies of lysates and immunoprecipitants from HEK293 cells expressing F-BRI2 deletion mutants plus Trem2 or Trem2 alone (V). The * indicates Trem2 species of unclear primary structure. Data information: This figure encompasses the comprehensive dataset employed for these specific experiments. We have included the images of the complete membranes used for Western blot analyses, without any cropping of information above or below the targeted signals.
Article Snippet: The plates were washed three times with PBST and incubated with either 1 μg/ml of
Techniques: Transfection, Western Blot, Expressing, Construct, Binding Assay, FLAG-tag

Journal: EMBO Reports
Article Title: Functional BRI2-TREM2 interactions in microglia: implications for Alzheimer’s and related dementias
doi: 10.1038/s44319-024-00077-x
Figure Lengend Snippet: ( A ) Schematic representation of the bicistronic expression plasmids used for HEK293 cell transfections in Panel ( B ): TREM2-3xFLAG + Myc-BRI2, 3xFLAG + Myc-BRI2 1-131 , 3xFLAG + Myc-BRI2 1-80 , and 3xFLAG + Myc-BRI2δ 80-131 . The TREM2-3xFLAG is expressed by the 5’ cistron, while BRI2 proteins are expressed by the 3’ cistron. ( B ) Western blot analysis using anti-FLAG, anti-Myc, and anti-human BRI2 antibodies of Total Lysate and Immunoprecipitation (M2-IP) samples from transfected HEK293 cells. “Glyc.” indicates glycosylated TREM2. The anti-human BRI2 antibody exhibits reactivity toward Myc-BRI2 and Myc-BRI2 1-131 suggesting recognition of an epitope located within the amino acids 80-131 region of BRI2. ( C ) Schematic representation of the bicistronic expression plasmids employed for HEK293 cell transfections in Panel ( D ): 3xFLAG-BRI2 + TREM2-Myc, 3xFLAG-BRI2 + TREM2-δIg-like-Myc, 3xFLAG-BRI2 + TREM2-CTF-Myc, 3xFLAG-BRI2 + TREM2-W198Ter-Myc, and 3xFLAG-BRI2 + TREM2-δ/α-site-Myc. The 3xFLAG-BRI2 is expressed by the 5’ cistron, while TREM2 proteins are expressed by the 3’ cistron. ( D ) Western blot analysis with anti-FLAG, anti-human TREM2-NT, and anti-human TREM2-CT antibodies of Total Lysate (T.L.) and Immunoprecipitation (IP) samples from transfected HEK293 cells. “Glyc.” indicates glycosylated TREM2. * Indicates protein signals of unclear nature. ** and *** indicate TREM2W198Ter signals of unclear primary structure. A longer exposure (Long Exposure) of the Anti-hTREM2-CT Western blot for the 3xFLAG-BRI2 + TREM2-Myc transfection revealed traces of TREM2-CTF precipitating with BRI2. Data information: This figure represents one of three independent experiments conducted. Data from the other two experiments are presented in Fig. . We have included the images of the complete membranes used for Western blot analyses, without any cropping of information above or below the targeted signals.
Article Snippet: The plates were washed three times with PBST and incubated with either 1 μg/ml of
Techniques: Expressing, Transfection, Western Blot, Immunoprecipitation

Journal: EMBO Reports
Article Title: Functional BRI2-TREM2 interactions in microglia: implications for Alzheimer’s and related dementias
doi: 10.1038/s44319-024-00077-x
Figure Lengend Snippet: ( A ) Western blot analysis with anti-FLAG, anti-Myc antibodies, and anti-human BRI2 antibodies of total lysates and immunoprecipitated samples (IP-M2) from transfected HEK293 cells. These experiments are biological replicates of the experiment shown in Fig. . ( B ) Western blot analysis with anti-FLAG, anti-human TREM2-NT, and anti-human TREM2-CT antibodies of total lysates (T.L.) and immunoprecipitated samples (IP-M2) from transfected HEK293 cells. These experiments are biological replicates of the experiment shown in Fig. . ( C ) Co-immunoprecipitation of endogenous Bri2 and Trem2 from mouse primary macrophages. Samples were deglycosylated before Western blot. Data Information: Panels ( A ) and ( B ) represent two independent experiments conducted similarly to those in Figs. B and , respectively. Panel ( C ) shows the only co-immunoprecipitation of endogenous Bri2 and Trem2 performed to date. The complete membrane images used for Western blot analyses are included without any cropping of information above or below the targeted signals.
Article Snippet: The plates were washed three times with PBST and incubated with either 1 μg/ml of
Techniques: Western Blot, Immunoprecipitation, Transfection, Membrane

Journal: EMBO Reports
Article Title: Functional BRI2-TREM2 interactions in microglia: implications for Alzheimer’s and related dementias
doi: 10.1038/s44319-024-00077-x
Figure Lengend Snippet: ( A ) Schematic representation of TREM2-ECD, sTREM2, BRI2-ECD and BRI2-BRICHOS recombinant proteins. TREM2-ECD encompasses the entire extracellular domain of TREM2, and BRI2-ECD encompasses the entire extracellular domain of BRI2, including the second putative TREM2-interacting domain. BRI2-BRICHOS and BRI2-ECD were fused with a 3xFLAG tag at their N-terminus, enabling immunoprecipitation using anti-FLAG M2-Agarose beads for the purification of protein complexes in a cell-free system via elution with a 3xFLAG peptide. The diagram highlights the signal peptides (SP), 7-Histidine tag (7-His, employed for protein purification), the 3XFLAG tag (3xF, utilized for complex purification), Ig-like domain (of TREM2), and BRICHOS domain (of BRI2). ( B ) BRI2-BRICHOS + sTREM2, BRI2-BRICHOS + TREM2-ECD, BRI2-ECD + sTREM2, BRI2-ECD + TREM2-ECD, sTREM2 alone, and TREM2-ECD alone were incubated overnight at 4 degrees Celsius with M2-Agarose beads at a concentration of 2 μM for each protein. Following extensive washing, complexes bound to M2-Agarose beads were specifically eluted using the 3xFLAG peptide. Unbound proteins and eluates (3xFLAG elu.) were analyzed by Western blot using either the anti-FLAG antibody M2 or an anti-human TREM2 N-terminal antibody (TREM2-NT). sTREM2 and TREM2-ECD were not recovered in the eluates when BRI2 recombinant proteins were absent. The * indicates residual BRI2-BRICHOS and BRI2-ECD dimers and oligomers. ( C ) BRI2-BRICHOS + sTREM2, BRI2-BRICHOS + TREM2-ECD, BRI2-ECD + sTREM2, BRI2-ECD + TREM2-ECD, 3xFLAG + sTREM2, 3xFLAG + TREM2-ECD, sTREM2 alone, and TREM2-ECD alone were incubated as in B. Proteins eluted with the 3xFLAG peptide were analyzed by Western blot using either M2 or TREM2-NT. sTREM2 and TREM2-ECD were not recovered in the eluates when BRI2 recombinant proteins were absent. The * indicates residual BRI2-BRICHOS and BRI2-ECD dimers and oligomers. ( D ) Western blot analysis using M2 and TREM2-NT antibodies of a new experiment mirroring the setup in ( B ). Eluates were separated under reducing and non-reducing conditions. BRI2-BRICHOS and BRI2-ECD monomers, dimers, trimers, and tetramers are indicated by the numbers 1, 2, 3, and 4, respectively. Higher multimolecular complexes are present but not labeled. The sTREM2 and TREM2-ECD bound to BRI2-BRICHOS and BRI2-ECD analyzed under non-reducing conditions show no significant increase in molecular weight compared to those analyzed under reducing conditions. ( E ) Decreasing concentrations (4, 2, 1, 0.5, 0.25, and 0 μM) of BRI2-BRICHOS and BRI2-ECD were incubated with 2 μM of either sTREM2 or TREM2-ECD and analyzed as described in ( C ). The bottom panel displays a Western blot of deglycosylated eluates using the TREM2-NT antibody. Data information: This figure encompasses the comprehensive dataset employed for these specific experiments. We have included the images of the complete membranes used for Western blot analyses, without any cropping of information above or below the targeted signals.
Article Snippet: The plates were washed three times with PBST and incubated with either 1 μg/ml of
Techniques: Recombinant, Immunoprecipitation, Purification, Protein Purification, Incubation, Concentration Assay, Western Blot, Labeling, Molecular Weight

Journal: EMBO Reports
Article Title: Functional BRI2-TREM2 interactions in microglia: implications for Alzheimer’s and related dementias
doi: 10.1038/s44319-024-00077-x
Figure Lengend Snippet: ( A ) HEK293 cells were transfected with Trem2 and either empty vector (V) or F-BRI2 (B). NT are non-transfected cells. Western blot of cell lysates with either the anti-FLAG antibody M2 or the anti-Trem2 antibody CT. Western blot of deglycosylated culture supernatants with the anti-Trem2 antibody NT1. *Indicates Trem2 species of unclear primary structure. ( B ) Quantification of Trem2, Trem2-CTF and sTrem2 levels detected by Western blot in ( A ). ( C ) HEK293 cells were transfected with Trem2 and either empty vector (V), F-BRI2 or deletion mutant F-BRI2 1-80 . Western blot of cell lysates with either the anti-FLAG antibody M2 or the anti-Trem2 antibody CT. Western blot of deglycosylated culture supernatants with the anti-Trem2 antibody NT1 (lower panel). The * indicates Trem2 species of unclear primary structure. ( D ) Quantification of Trem2, Trem2-CTF and sTrem2 levels detected by Western blot in ( C ). ( E ) HEK293 cells were transfected with either Trem2 (T) or empty vector (V). Following transfection, lysates and media underwent deglycosylation and were subsequently analyzed by Western blot using anti-Trem2 antibodies CT and NT1. In the CT Western blot, the asterisk (*) indicates a Trem2-derived polypeptide that retains the CT epitope and is likely to lack part of the N-terminal Trem2 sequence, causing a reduction in size. In the NT1 Western blot, the double asterisk (**) highlights a Trem2-derived polypeptide that retains the NT1 epitope and is likely to lack part of the C-terminal sequence. The presence of this band primarily in cell lysates suggests potential retention of the transmembrane region and/or localization within intracellular compartments. Its low-level detection in the media further suggests intracellular origin. The band marked as sTrem2 is marked as sTrem2 because: (1) is of the expected size for deglycosilated sTrem2; (2) it is notably enriched in the media, consistent with the preferential localization of sTrem2 in extracellular fluids. Data information: This figure encompasses the comprehensive dataset employed for these specific experiments. We have included the images of the complete membranes used for Western blot analyses, without any cropping of information above or below the targeted signals. Statistical comparisons among the groups were conducted using two-tailed unpaired t test ( B ) and one-way ANOVA followed by post-hoc Tukey’s multiple comparisons test when ANOVA showed significant differences ( C , D ). * P < 0.05, ** P < 0.01, *** P < 0.001. The data presented are derived from are from: Trem2+Vector transfectant n = 5, Trem2+F-BRI2 transfectant n = 5 ( A , B ); Trem2+Vector transfectant n = 3, Trem2+F-BRI2 transfectant n = 3, Trem2+F-BRI2 1-80 n = 3 ( C , D ); the letter “n” indicates biological replicates. All data are expressed as means +/− SEM. .
Article Snippet: The plates were washed three times with PBST and incubated with either 1 μg/ml of
Techniques: Transfection, Plasmid Preparation, Western Blot, Mutagenesis, Derivative Assay, Sequencing, Two Tailed Test

Journal: EMBO Reports
Article Title: Functional BRI2-TREM2 interactions in microglia: implications for Alzheimer’s and related dementias
doi: 10.1038/s44319-024-00077-x
Figure Lengend Snippet: ( A ) Schematic representation of ELISA 1 and ELISA 2. Both ELISAs use the same Biotinylated-αTrem2 capture antibody (in black). ELISA 1 uses αTrem2-CT (red) + Sulfo-αRabbit (blue) detection antibodies. ELISA 2 uses αTrem2-NT (orange) + Sulfo-αRat (green) detection antibodies. Trem2 can be detected by both ELISAs, sTrem2 can be detected only by ELISA 2: neither ELISA can detect Trem2-CTF. ( B ) Quantification of Trem2 and sTrem2 in the P100 and S100 brain fractions of ~245 days old w/w control, Itm2b-KO and Trem2-KO mice. ( C ) Western blot analysis of P100 fractions from a representative w/w, Trem2-KO and Itm2b-KO P100 sample with αTrem2-CT and an αBri2 antibody. *Indicates a non-specific band. ( D ) Detection and quantification of Trem2-CTF in the P100 fraction by Western blot analysis and with Image Lab software; GAPDH was used as a loading control. ( E ) ELISA measurements of endogenous Aβ40 and Aβ42 in brain homogenates of w/w, Trem2-KO and Itm2b-KO animals. Data information: This figure encompasses the comprehensive dataset employed for these specific experiments. The membrane in ( C ) was cut at the 20 and 15 kDa molecular weight marker (MWM). The upper section was probed with the anti-Bri2 antibody, while the lower section was probed with the Trem2-CT antibody. Similarly, in ( D ), the two membranes were divided at the 20 and 15 kDa MWM. The upper portion was probed with the anti-Gapdh antibody, while the lower portion was probed with the Trem2-CT antibody. Statistical comparisons among the groups were conducted using one-way ANOVA followed by post-hoc Tukey’s multiple comparisons test when ANOVA showed significant differences ( B , E ); two–way ANOVA followed by post-hoc Sidak’s multiple comparisons test when ANOVA showed significant differences ( D ). ** P < 0.01, *** P < 0.001, **** P < 0.0001. The data presented are derived from are from w/w control, females n = 7, males n = 12; Itm2b-KO females n = 6, males n = 7; Trem2-KO , females n = 6, males n = 7; the letter “n” indicates biological replicates. All data are expressed as means +/− SEM. .
Article Snippet: The plates were washed three times with PBST and incubated with either 1 μg/ml of
Techniques: Enzyme-linked Immunosorbent Assay, Control, Western Blot, Software, Membrane, Molecular Weight, Marker, Derivative Assay

Journal: EMBO Reports
Article Title: Functional BRI2-TREM2 interactions in microglia: implications for Alzheimer’s and related dementias
doi: 10.1038/s44319-024-00077-x
Figure Lengend Snippet: ( A ) CD11b and CD45 staining, and FACS analysis of brain cells isolated from Cx3cr1 CreER/wt and Cx3cr1 wt/wt animals. ( B ) FACS analysis of sorted EYFP + (microglia) and EYFP - (non-microglia) brain cell populations from Itm2b f/f :Cx3cr1 CreER/wt animals. ( C ) Schematic representation of the PCR test used to identify the Itm2b f and Itm2b KO alleles. ( D ) PCR analysis of genomic DNA isolated from EYFP + and EYFP - cells sorted from Itm2b f/f :Cx3cr1 CreER/wt brains. ( E ) Analysis of Itm2b and Trem2 mRNA expression in sorted EYFP + (microglia) and EYFP - (non-microglia) brain cell populations from ~14 months-old Itm2b f/f :Cx3cr1 CreER/wt and Itm2b w/w :Cx3cr1 CreER/wt animals. ( F ) ELISA 2 was used to measure sTrem2 levels in Itm2b f/f :Cx3cr1 CreER/wt and Itm2b f/f :Cx3cr1 wt/wt littermates. Data information: Statistical comparisons among the groups were conducted two-way ANOVA followed by post-hoc Sidak’s multiple comparisons test when ANOVA showed significant differences ( E ); two-tailed unpaired t test ( F ). ** P < 0.01, *** P < 0.001, **** P < 0.0001. The data presented are derived from: (E) Itm2b f/f :Cx3cr1 CreER/wt , females n = 5, males n = 7; Itm2b w/w :Cx3cr1 CreER/wt , females n = 3, males n = 4; ( F ) Itm2b f/f :Cx3cr1 CreER/wt , females n = 15, males n = 12; Itm2b f/f :Cx3cr1 wt/wt , females n = 10, males n = 11; the letter “n” indicates biological replicates. All data are expressed as means +/− SEM. .
Article Snippet: The plates were washed three times with PBST and incubated with either 1 μg/ml of
Techniques: Staining, Isolation, Expressing, Enzyme-linked Immunosorbent Assay, Two Tailed Test, Derivative Assay

Journal: EMBO Reports
Article Title: Functional BRI2-TREM2 interactions in microglia: implications for Alzheimer’s and related dementias
doi: 10.1038/s44319-024-00077-x
Figure Lengend Snippet: ( A ) Quantification of sTrem2 in the S100 brain fractions of ~245 days old control and FDD-KI mice. Data were analyzed by unpaired T -test. All data are shown as means +/− SEM: **** P < 0.0001. ( B ) Quantification of Trem2-CTF in the P100 fraction by Western blot analysis and with Image Lab software. ( C ) Red Ponceau staining (upper panel) was used to normalize the Trem2-CTF signal (lover panel) obtained by Western blot. Data information: Statistical comparisons among the groups were conducted using unpaired T -test. **** P < 0.0001. The data presented are derived from: ( A ) w/w mice (females, n = 7; males, n = 12) and FDD-KI mice (females, n = 8; males, n = 9) mice; ( B ) w/w mice (females, n = 3; males, n = 3) and FDD-KI mice (females, n = 6; males, n = 7) mice; the letter “n” indicates biological replicates. All data are expressed as means +/− SEM. .
Article Snippet: The plates were washed three times with PBST and incubated with either 1 μg/ml of
Techniques: Control, Western Blot, Software, Staining, Derivative Assay

Journal: EMBO Reports
Article Title: Functional BRI2-TREM2 interactions in microglia: implications for Alzheimer’s and related dementias
doi: 10.1038/s44319-024-00077-x
Figure Lengend Snippet: ( A ) Quantification of sTrem2 in the conditioned media of WT and Itm2b-KO primary microglia using ELISA (left panel) and Western blot of deglycosylated conditioned media with Trem2 NT antibody (quantification of Western blot is shown in the second panel). Trem2 CT antibody does not show any signal. ( B ) Quantification of sTrem2 in the conditioned media of WT and Itm2b-KO primary microglia after 5 h of serum starvation by ELISA. ( C ) Quantification of sTrem2 in the conditioned media of WT and Itm2b-KO primary microglia after 1 and 2 h with either vehicle (Veh) or E. coli by ELISA. ( D ) Western blot of deglycosylated cell lysates from WT and Itm2b-KO primary microglia, 2 h after E. coli stimulation, with Trem2 CT antibody to visualize Trem2 f.l. and Trem2-CTF, along with quantification of the Trem2-CTF/Trem2 f.l. ratio. ( E ) Quantification of the Trem2-CTF/Trem2 f.l. ratio for only the two untreated (Veh) groups. ( F ) Analysis of Itm2b and Trem2 mRNA expression in WT and Itm2b-KO primary microglia using quantitative RT-PCR. ( G ) A second set of biological replicates was analyzed following the same procedure as in panel ( C ). ( H ) A second set of biological replicates was analyzed following the same procedure as in panel ( D ). ( I ) A second set of biological replicates was analyzed following the same procedure as in panel ( F ). Data information: Statistical comparisons among the groups were conducted using either a two-tailed unpaired t -test ( A , B , E , F , I ) or a two-way ANOVA followed by post-hoc Sidak’s multiple comparisons test when ANOVA indicated significant differences ( C , D , G , H ). * P < 0.05, ** P < 0.01, *** P < 0.001, ****P < 0.0001. The data presented are derived from WT primary microglia cultures ( n = 3 for ( A , C , D , E – I ), n = 6 for ( B )) and Itm2b-KO primary microglia ( n = 3 for Exp. and n = 3 for ( A , C , D , E – I ), n = 6 for ( B )); the letter “n” indicates biological replicates, except for ( B ), which includes 3 biological replicates with 2 technical replicates each. Each biological replicate was composed of primary microglia generated from 2 P2 pups. All data are expressed as means +/− SEM. .
Article Snippet: The plates were washed three times with PBST and incubated with either 1 μg/ml of
Techniques: Enzyme-linked Immunosorbent Assay, Western Blot, Expressing, Quantitative RT-PCR, Two Tailed Test, Derivative Assay, Generated

Journal: EMBO Reports
Article Title: Functional BRI2-TREM2 interactions in microglia: implications for Alzheimer’s and related dementias
doi: 10.1038/s44319-024-00077-x
Figure Lengend Snippet: ( A ) Western blot analysis with Trem2 CT antibody of deglycosylated cell lysates from Itm2b-KO microglia treated with either vehicle (PBS) or a 2 μM concentration of BRI2-ECD. Quantification of the Trem2-CTF/Trem2 f.l. ratios from the Western blot shown in the right panel. ( B ) sTrem2 ELISA on conditioned media from these cell cultures (left panel). The right panel shows an ELISA performed using media from cells treated with vehicle and incubated before and during the ELISA with either vehicle (PBS) or 2 μM of BRI2-ECD. The evidence that incubation with BRI2-ECD does not change the ELISA quantification indicates that BRI2-ECD does not interfere with the quantification of sTrem2 by ELISA. ( C ) Western blot analysis with anti-Syk and anti-pSyk antibodies of cell lysates from Itm2b-KO microglia treated with either vehicle (PBS) or a 2 μM concentration of BRI2-ECD. Quantification of the pSyk/Syk ratios from the Western blot is shown in the right panel. Data information: This figure encompasses the comprehensive dataset employed for these specific experiments. We have included the images of the complete membranes used for Western blot analyses, without any cropping of information above or below the targeted signals. Statistical comparisons among the groups were conducted using a two-tailed unpaired t -test. * P < 0.05, ** P < 0.01, **** P < 0.0001. The data presented are derived from Itm2b-KO primary microglia ( n = 3 for each condition); the letter “n” indicates biological replicates. Each biological replicate was composed of primary microglia generated from 2 P2 pups. All data are expressed as means +/− SEM. .
Article Snippet: The plates were washed three times with PBST and incubated with either 1 μg/ml of
Techniques: Western Blot, Concentration Assay, Enzyme-linked Immunosorbent Assay, Incubation, Two Tailed Test, Derivative Assay, Generated

Journal: EMBO Reports
Article Title: Functional BRI2-TREM2 interactions in microglia: implications for Alzheimer’s and related dementias
doi: 10.1038/s44319-024-00077-x
Figure Lengend Snippet: Reagents and tools.
Article Snippet: The plates were washed three times with PBST and incubated with either 1 μg/ml of
Techniques: Recombinant, Enzyme-linked Immunosorbent Assay, Sequencing, Gene Expression, Blocking Assay, Western Blot, Isolation, Biomarker Discovery, Software, Imaging, Real-time Polymerase Chain Reaction
Journal: The Journal of Biological Chemistry
Article Title: TREM2-activating antibodies abrogate the negative pleiotropic effects of the Alzheimer's disease variant Trem2 R47H on murine myeloid cell function
doi: 10.1074/jbc.RA118.001848
Figure Lengend Snippet: Gene-edited Trem2R47H and Trem2−/− mice are specifically modified in the TREM2 gene with no off-target effects on other TREM genes in the locus unlike the Trem2KOMP mice. A, no detectable Trem2 mRNA in the gene-edited Trem2−/− brains under any treatment conditions; B, Trem2 mRNA is significantly down-regulated upon LPS treatment in WT and R47H Trem2 brains; C, no detectable Trem2 mRNA in the gene-edited Trem2KOMP brains under any treatment conditions; D and E, Trem1 is up-regulated upon LPS stimulation in gene-edited Trem2−/− and Trem2R47H brains, comparable with corresponding WT control brains; F, Trem1 up-regulation in the Trem2KOMP−/− mice post-stimulation is lower compared with the in-house mice and age-matched littermate WT controls; G and H, no significant changes were noted in Treml1 levels in WT, gene-edited Trem2−/−, and Trem2R47H brain samples with saline treatment and LPS stimulations; I, Treml1 is highly up-regulated in the Trem2KOMP−/− mice under basal conditions (saline treatment) and remains high upon LPS treatment; J and K, Treml2 is up-regulated 2–4-fold upon LPS treatment in the in-house Trem2−/− mice and the Trem2R47H mice; L, Treml2 mRNA is significantly reduced in the Trem2KOMP mice under both basal and LPS-stimulated conditions. All results are presented as -fold change over saline-treated WT controls. *, p < 0.05; **, p < 0.01; ***, p < 0.001; ****, p < 0.0001; data represented as mean ± S.D.; statistical analysis: one-way ANOVA with Sidak's correction for multiple comparison.
Article Snippet: Rat monoclonal anti-human/mouse TREM2 (rat IgG2b clone 237920, R&D Systems) and internally generated
Techniques: Modification, Saline, Comparison

Journal: The Journal of Biological Chemistry
Article Title: TREM2-activating antibodies abrogate the negative pleiotropic effects of the Alzheimer's disease variant Trem2 R47H on murine myeloid cell function
doi: 10.1074/jbc.RA118.001848
Figure Lengend Snippet: Trem2R47H macrophages and microglia reveal a cell survival defect that is similar to but less severe than the Trem2−/− population. A, Trem2R47H mouse BMDMs exhibit a survival defect when cultured under limiting conditions of CSF-1. B, Trem2−/− BMDMs had a more pronounced survival defect in similar culture conditions; C and D, Trem2R47H (blue) and Trem2−/− (red) mouse adult microglia exhibit a survival defect in culture; E, a significant increase in annexin V–stained BMDM population was detected at 6 and 7 days in culture in the case of the Trem2R47H BMDMs, supportive of increased apoptotic events; F, the total numbers of necrotic events 6 and 7 days in culture in the Trem2R47H BMDMs were comparable with WT macrophages; G, increased annexin V+ populations were noted at days 6 and 7 in Trem2−/− BMDMs; H, Trem2−/− BMDMs had significantly increased PI+ populations at day 7 compared with Trem2+/+ BMDMs, supportive of increased necrotic events in these populations. Data are presented as mean ± S.D. (error bars) and are from a representative experiment. The experiment was conducted twice independently. *, p < 0.05, **, p < 0.01; ***, p < 0.001; ****, p < 0.0001. Statistical analysis: two-way ANOVA with Sidak's correction for multiple comparisons (A–D) or Dunnett's correction for multiple comparisons (E–H).
Article Snippet: Rat monoclonal anti-human/mouse TREM2 (rat IgG2b clone 237920, R&D Systems) and internally generated
Techniques: Cell Culture, Staining

Journal: The Journal of Biological Chemistry
Article Title: TREM2-activating antibodies abrogate the negative pleiotropic effects of the Alzheimer's disease variant Trem2 R47H on murine myeloid cell function
doi: 10.1074/jbc.RA118.001848
Figure Lengend Snippet: RNA-Seq analysis provides molecular corroboration for the more subtle effect of the variant and modulation of several genes linked to AD. A, transcript heat map of differentially regulated genes between various treatment groups (n = 5 animals/genotype) is supportive of an intermediate perturbation in the Trem2R47H BMDMs compared with Trem2−/− and WT BMDMs. B, WGCNA analysis resulted in the identification of five modules/gene networks that are differentially regulated in the knockout and variant macrophages compared with WT. C–J, a subset of genes, including Apoe (C and D), Il-1α (E and F), C1qa (G and H), and C3 (I and J), confirmed as differentially regulated in R47H macrophages (C, E, G, and I; blue graphs) and knockout macrophages (D, F, H, and J; red graphs) by qPCR in a time course study. Data are presented as mean ± S.D. (error bars) and are from a representative experiment. The experiment was conducted twice independently. *, p < 0.05; ***, p < 0.001; ****, p < 0.0001.
Article Snippet: Rat monoclonal anti-human/mouse TREM2 (rat IgG2b clone 237920, R&D Systems) and internally generated
Techniques: RNA Sequencing Assay, Variant Assay, Knock-Out

Journal: The Journal of Biological Chemistry
Article Title: TREM2-activating antibodies abrogate the negative pleiotropic effects of the Alzheimer's disease variant Trem2 R47H on murine myeloid cell function
doi: 10.1074/jbc.RA118.001848
Figure Lengend Snippet: R47H microglia produce lower levels of pro-inflammatory cytokines upon an acute in vivo challenge. A–C, CD11b+ cells isolated from brains of Trem2R47H animals treated with LPS for 24 h show a significant reduction in Il-1β (A), Il-6 (B), and Tnf-α (C) mRNA levels relative to Trem2+/+ animals. D–F, BMDMs from Trem2R47H animals show significant reductions in CCL2 (D), CXCL10 (E), and CCL5 (F) levels following treatment with Aβ(1–42) compared with WT littermates. *, p < 0.05; **, p < 0.01; ***, p < 0.001; ****, p < 0.0001; data represented as mean ± S.D. Statistical analysis: one-way ANOVA with Sidak's correction for multiple comparison.
Article Snippet: Rat monoclonal anti-human/mouse TREM2 (rat IgG2b clone 237920, R&D Systems) and internally generated
Techniques: In Vivo, Isolation, Comparison

Journal: The Journal of Biological Chemistry
Article Title: TREM2-activating antibodies abrogate the negative pleiotropic effects of the Alzheimer's disease variant Trem2 R47H on murine myeloid cell function
doi: 10.1074/jbc.RA118.001848
Figure Lengend Snippet: An antibody that boosts TREM2 signaling also modulates myeloid cell function. A and B, antibody 1 activates TREM2/DAP12-mediated Syk signaling in Trem2+/+ and Trem2R47H BMDMs. The effect is less pronounced in the Trem2R47H BMDMs compared with WT BMDMs; the TREM2 agonist antibody does not increase pSyk levels in the Trem2−/− BMDMs, confirming a TREM2-specific effect. No significant differences were observed in total Syk levels or in the loading control (actin). Data are shown from a representative set of animals. C, the antibody also restores the survival defect in Trem2R47H microglia, as demonstrated in a real-time cell confluence assay. Isotype control antibody (blue) is not able to achieve the same boost in survival. Data are plotted as mean ± S.D. (error bars) and are from a single representative experiment. The experiment was conducted twice independently. D, improved survival was also noted in Trem2R47H BMDMs with antibody 1 treatment (green) relative to isotype control (blue hash). E, BMDMs obtained from aged (18-month-old) R47H animals also demonstrate a similar survival defect that can be rescued with agonist antibody treatment (green), whereas the isotype control has no effect (blue hash). F, antibody 1 treatment significantly increased migration toward recombinant C5a as a chemoattractant in Trem2+/+ microglia relative to isotype control. G, antibody 1 treatment significantly increased migration toward recombinant C5a + Aβ(1–42) as a chemoattractant in Trem2+/+ and Trem2R47H microglia relative to isotype control. *, p < 0.05; ***, p < 0.001; ****, p < 0.0001; data represented as mean ± S.D.
Article Snippet: Rat monoclonal anti-human/mouse TREM2 (rat IgG2b clone 237920, R&D Systems) and internally generated
Techniques: Cell Function Assay, Migration, Recombinant

Journal: The Journal of Biological Chemistry
Article Title: TREM2-activating antibodies abrogate the negative pleiotropic effects of the Alzheimer's disease variant Trem2 R47H on murine myeloid cell function
doi: 10.1074/jbc.RA118.001848
Figure Lengend Snippet: In vitro profiling of a second TREM2-activating antibody with a different myeloid function modulation profile compared with antibody 1. A and B, an internally generated agonist antibody (antibody 2) also showed a similar boost in survival of Trem2R47H macrophages (A, purple bar) and microglia (B, purple bar) as antibody 1 relative to isotype control (blue hash, A and B). C and D, no increase in migration was observed in Trem2+/+ (black) and Trem2R47H microglia (purple) following treatment with antibody 2 relative to isotype control (blue) both in the presence and absence of rC5a alone or rC5a + Aβ as a chemoattractant. *, p < 0.05; ***, p < 0.001; ****, p < 0.0001; data represented as mean ± S.D.
Article Snippet: Rat monoclonal anti-human/mouse TREM2 (rat IgG2b clone 237920, R&D Systems) and internally generated
Techniques: In Vitro, Generated, Migration
Journal: Nature Neuroscience
Article Title: Derivation and transcriptional reprogramming of border-forming wound repair astrocytes after spinal cord injury or stroke in mice
doi: 10.1038/s41593-024-01684-6
Figure Lengend Snippet: a . Top GO Biological Processes associated with 158 cARGs upregulated at all times after SCI. b . Immunohistochemistry of S100a6 and Lgals3 protein in lesion border astrocytes (LBA) after stroke (S100a6) or SCI (Lgals3). Note that while S100a6 is present in the processes of most LBA, Lgals3 is present in some but not others. c,d . Heatmaps of mean log 2 FC after SCI of 20 cARGs that are either most enriched ( c ) or most de-enriched ( d ) in astrocytes compared with other cells; graphs compare log 2 FC with mean log 2 FE in selected examples. e . Comparison of expression (FPKM) of Tyrobp and Trem2 by astrocytes and other cells at different times after SCI. Note that between 5, 14 and 28 days after SCI, expression levels of Tyrobp and Trem2 increase markedly in other cells while simultaneously decreasing markedly in astrocytes. Such a divergence in DEG levels would not be observed if Tyrobp and Trem2 levels in astrocytes were an artifact caused by the non-specific contamination of RiboTag IP samples by highly expressed transcripts derived from other cells. f . Expression (FPKM) by astrocytes and other cells of chondroitin sulphate proteoglycans (CSPGs) after SCI. Note that the prototypical CSPG, Acan , is not detectably expressed by astrocytes at any time after SCI, and Vcan and Csp4 were far more highly expressed by non-astrocytes. Only Bcan and Ncan are more highly expressed by astrocytes, but Bcan expression declines after SCI to levels below healthy, and although Ncan expression increases at 5 days after SCI, by 28 days it also declined to levels lower than in healthy astrocytes. Line plots are mean values +/- SEM where n = 4 mice for uninjured and all post SCI timepoints except 2d which was n = 5. P-Values in (a) calculated by two-sided Fisher’s exact test.
Article Snippet: Primary antibodies used included goat anti-A2m (1:300, AF1938; R&D Systems), rabbit anti-Aldh1l1 (1:1,000, Ab87117; Abcam), sheep anti-BrdU (1:800, NB-500-235; Novus), rat anti-C3 (1:400, NB200-540; Novus), goat anti-CD13 (1:600, AF2335; R&D Systems), rat anti-Cd44 (1:400, 14-0441-82; Invitrogen), rat anti-CD68 (1:1,000, MCA1957; Biorad), rabbit anti-Cd74 (1:200, A13958; Abclonal), rabbit anti-Cdsn (1:800,13184-1-AP; Proteintech), goat anti-Cxcl10 (1:200, AF-466; Novus), rabbit anti-Dnali1 (1:500, 17601-1-AP; Proteintech), rabbit anti-Fxyd1 (1:800, A15082; Abclonal), rabbit anti-GFAP (1:2,000, GA524, Z033401-2; Dako/Agilent), rat anti-GFAP (1:1,000, 13-0300; ThermoFisher), rabbit anti-hemagglutinin (1:1,000, H6908; Sigma-Aldrich), goat anti-Gpc5 (1:200, AF2607; R&D Systems), rabbit anti-Gpx1 (1:200, 29329-1-AP; Proteintech), goat anti-hemagglutinin (1:800, NB600-362; Novus Biologicals), rabbit anti-H2-Ab1 (1:200, A18658; Abclonal), rabbit anti-Hpse (1:200, 24529-1-AP; Proteintech), guinea pig anti-Iba1 (1:1,000, 234004; Synaptic Systems), rabbit anti-Iba-1 (1:800, 019-19741; Wako), rabbit anti-Id3 (1:500, 9837; Cell Signaling), rabbit anti-Kcnj10 (Kir4.1) (1:400, APC-035; Alomone Labs), rat anti-Lgals3 (1:200, 14-5301-82; ThermoFisher), rabbit anti-Lxn (1:500, 13056-1-AP; Proteintech), rabbit anti-Mfge8 (1:200, A12322; Abclonal), rabbit anti-Mmp12 (1:200, 22989-1-AP; Proteintech), goat anti-Myoc (1:400, AF2537; Novus), guinea pig anti-NeuN (1:1,000, 266004; Synaptic Systems), rabbit anti-NeuN (1:1,000, ab177487; Abcam), guinea pig anti-Olig2 (1:800, ABE1024; Millipore), rabbit anti-Olig2 (1:200, AB9610; Millipore), rabbit anti-Padi2 (1:300,12110-1-AP; Proteintech), rabbit anti-Prdx6 (1:500, 13585-1-AP; Proteintech), sheep anti-S100a6 (1:300, AF4584; R&D Systems), rabbit anti-S100a6 (1:200, A3461; Abclonal), goat anti-Serpina3n (1:200, AF4709; R&D Systems), goat anti-Sox9 (1:800, AF3075; R&D Systems), rabbit anti-Sox9 (1:800, 702016; ThermoFisher), goat anti-Sox10 (1:500, AF2864; R&D Systems), guinea pig anti-tdT (RFP) (1:1,500, 390-004; Synaptic Systems), rabbit anti-RFP (1:1,500, 600-401-379; Rockland), rabbit anti-Timp1 (1:800, 16644-1-AP; Proteintech),
Techniques: Immunohistochemistry, Comparison, Expressing, Derivative Assay

Journal: Nature Neuroscience
Article Title: Derivation and transcriptional reprogramming of border-forming wound repair astrocytes after spinal cord injury or stroke in mice
doi: 10.1038/s41593-024-01684-6
Figure Lengend Snippet: a , Violin plots of snRNA-seq detected genes enriched in reactive astrocyte clusters compared with uninjured. b , IHC of proteins Tyrobp and Trem2 in LBAs after SCI. c , d , Selected astrocyte DEGs exhibiting different patterns of expression changes in the form of acute rise followed by decline ( c ) or delayed but persistent increase ( d ) after SCI as detected by Astro-RiboTag RNA-seq. e , f , g , IHC of proteins C3 ( e ), S100a6 ( f ) and Prdx6 ( g ) in LBAs after SCI. Boxes show locations of expanded regions. h , Scatterplot comparing mean log 2 FC and mean FPKM of 1,927 pARGs upregulated at least twofold from 28 to 70 days after SCI as detected by Astro-RiboTag RNA-seq. i , Scatterplot comparing mean log 2 FC and mean log 2 FE of 1,927 pARGs upregulated from 28 to 70 days after SCI. j , GO-BPs associated with 1,927 pARGs upregulated at least twofold from 28 to 70 days after SCI. k , Summary schematic showing local astrocyte responses to CNS tissue damage by dedifferentiation, proliferation and transcriptional reprogramming into border-forming wound repair astrocytes. Line plots are mean values; error bars, s.e.m.; n = 4 mice for uninjured and all post-SCI timepoints except day 2 ( n = 5). P values in ( j ) calculated by two-sided Fisher’s exact test.
Article Snippet: Primary antibodies used included goat anti-A2m (1:300, AF1938; R&D Systems), rabbit anti-Aldh1l1 (1:1,000, Ab87117; Abcam), sheep anti-BrdU (1:800, NB-500-235; Novus), rat anti-C3 (1:400, NB200-540; Novus), goat anti-CD13 (1:600, AF2335; R&D Systems), rat anti-Cd44 (1:400, 14-0441-82; Invitrogen), rat anti-CD68 (1:1,000, MCA1957; Biorad), rabbit anti-Cd74 (1:200, A13958; Abclonal), rabbit anti-Cdsn (1:800,13184-1-AP; Proteintech), goat anti-Cxcl10 (1:200, AF-466; Novus), rabbit anti-Dnali1 (1:500, 17601-1-AP; Proteintech), rabbit anti-Fxyd1 (1:800, A15082; Abclonal), rabbit anti-GFAP (1:2,000, GA524, Z033401-2; Dako/Agilent), rat anti-GFAP (1:1,000, 13-0300; ThermoFisher), rabbit anti-hemagglutinin (1:1,000, H6908; Sigma-Aldrich), goat anti-Gpc5 (1:200, AF2607; R&D Systems), rabbit anti-Gpx1 (1:200, 29329-1-AP; Proteintech), goat anti-hemagglutinin (1:800, NB600-362; Novus Biologicals), rabbit anti-H2-Ab1 (1:200, A18658; Abclonal), rabbit anti-Hpse (1:200, 24529-1-AP; Proteintech), guinea pig anti-Iba1 (1:1,000, 234004; Synaptic Systems), rabbit anti-Iba-1 (1:800, 019-19741; Wako), rabbit anti-Id3 (1:500, 9837; Cell Signaling), rabbit anti-Kcnj10 (Kir4.1) (1:400, APC-035; Alomone Labs), rat anti-Lgals3 (1:200, 14-5301-82; ThermoFisher), rabbit anti-Lxn (1:500, 13056-1-AP; Proteintech), rabbit anti-Mfge8 (1:200, A12322; Abclonal), rabbit anti-Mmp12 (1:200, 22989-1-AP; Proteintech), goat anti-Myoc (1:400, AF2537; Novus), guinea pig anti-NeuN (1:1,000, 266004; Synaptic Systems), rabbit anti-NeuN (1:1,000, ab177487; Abcam), guinea pig anti-Olig2 (1:800, ABE1024; Millipore), rabbit anti-Olig2 (1:200, AB9610; Millipore), rabbit anti-Padi2 (1:300,12110-1-AP; Proteintech), rabbit anti-Prdx6 (1:500, 13585-1-AP; Proteintech), sheep anti-S100a6 (1:300, AF4584; R&D Systems), rabbit anti-S100a6 (1:200, A3461; Abclonal), goat anti-Serpina3n (1:200, AF4709; R&D Systems), goat anti-Sox9 (1:800, AF3075; R&D Systems), rabbit anti-Sox9 (1:800, 702016; ThermoFisher), goat anti-Sox10 (1:500, AF2864; R&D Systems), guinea pig anti-tdT (RFP) (1:1,500, 390-004; Synaptic Systems), rabbit anti-RFP (1:1,500, 600-401-379; Rockland), rabbit anti-Timp1 (1:800, 16644-1-AP; Proteintech),
Techniques: Expressing, RNA Sequencing Assay
Journal: bioRxiv
Article Title: Microglia at Sites of Atrophy Restrict the Progression of Retinal Degeneration via Galectin-3 and Trem2 Interactions
doi: 10.1101/2023.07.19.549403
Figure Lengend Snippet: ( A ) Violin plots showing the upregulation of genes ( Lgals3, Syk and Ctnnb1I) related to Trem2 signaling by subretinal microglia from the integrated dataset of all four mouse models. ( B ) Images of Iba1 (green) and Trem2 (red) staining in naïve microglia from inner retina and subretinal microglia in LD. ( C ) Images of Iba1 (green) and Syk (red) staining in subretinal microglia and microglia from inner retina in LD. ( D ) 3D rendering images of Gal3 (green), Trem2 (red) and Iba1 (white) staining in subretinal microglia in LD. Views from both the apical RPE aspect and neuroretina aspect are shown. ( E ) Images of Iba1 (green), Trem2 (red) and Gal3 (magenta) staining in subretinal microglia between control and Trem2 cKO mice in LD. ( F-H ) Quantifications of Trem2 depletion (F, n=4 per group), Iba1 + cells (G, n=9) and Gal3 + cells (H, n=9) between control and Trem2 cKO mice. ( I ) Fundus images showing increased subretinal white lesions in of Trem2 cKO mice in LD as indicated by arrows. Images from four individual mice per group are shown. ( J ) Images of phalloidin staining in RPE tissues from control and Trem2 cKO mice in LD. ( K ) Quantifications of dysmorphic RPE cells between control and Trem2 cKO mice (n=9 per group). Scale bars: 50μm (D); 100μm (B, C E,and J). Data were collected from 2 independent experiments. **: p<0.01; ***: p<0.001. Unpaired Student’s t-test (F-H).
Article Snippet: Capture antibody of
Techniques: Staining

Journal: bioRxiv
Article Title: Microglia at Sites of Atrophy Restrict the Progression of Retinal Degeneration via Galectin-3 and Trem2 Interactions
doi: 10.1101/2023.07.19.549403
Figure Lengend Snippet: ( A ) Split views of confocal scans showing the colocalization of Trem2 (red) and Gal3 (green) in the subretinal microglia. Lines indicate the RPE-facing and neuroretina (NR)-facing aspects as indicated. ( B ) Fundus images showing increased subretinal white lesions in anti-Trem2 mAb178 treated mice in LD as indicated by arrows. Images of 4 individual mice per group are shown. ( C ) Images of Iba1 (green) and Gal3 (magenta) staining in subretinal microglia between control and mAb178-treated mice in LD. Scale bar: 100 μm. ( D and E ) Quantifications of Iba1 + cells and Gal3 + cells between control and mAb178 (n=8 per group). ( F ) Images of phalloidin staining in RPE flatmounts from control and mAb178 treated mice in LD. Scale bar: 100μm. ( G ) Quantifications of dysmorphic RPE cells between control (n=8) and mAb178 (n=9) treated mice. ( H ) Images of Iba1 (green) and Trem2 (red) in microglia from the inner retina of naïve control and Trem2 cKO mice. Scale bar: 50μm.
Article Snippet: Capture antibody of
Techniques: Staining

Journal: bioRxiv
Article Title: Microglia at Sites of Atrophy Restrict the Progression of Retinal Degeneration via Galectin-3 and Trem2 Interactions
doi: 10.1101/2023.07.19.549403
Figure Lengend Snippet: ( A ) ELISA of soluble Trem2 (sTrem2) in vitreous fluid and retinal fluid from naïve WT mice, WT and Trem2 cKO mice subjected to LD. ( B ) Fundus images of mice treated with isotype control or 4D9 anti-Trem2 in LD. Four individual mice per group are shown. ( C ) Representative OCT images of mice treated with isotype or 4D9 in LD. ( D ) Quantifications of outer nuclear layer (ONL) thickness by OCT (n=13 per group). ONL thickness was measured at both nasal and temporal sides. ( E and F ) Scotopic a-waves and b-waves of ERG data among mice treated with isotype or 4D9 in naïve or LD setting (n=5 per group). ( G ) Fundus images of Gal3 cKO mice treated with isotype or 4D9 in LD. Four individual mice per group are shown. ( H ) Representative OCT images of Gal3 cKO mice treated with isotype control or 4D9 anti-Trem2 in LD. ( I ) Quantifications of average ONL thickness by OCT between control and Gal3 cKO mice treated with either isotype or 4D9 (n=13 per group). ( J ) Images of phalloidin staining of control and Gal3 cKO RPE treated with isotype or 4D9 in LD. ( K ) Quantifications of dysmorphic RPE cells (n=15, 13, 11 and 13, respectively). Scale bars: 100μm. Data were collected from 2-4 independent experiments. *: p<0.05; **: p<0.01; ***: p<0.001. Unpaired Student’s t-test (F-H). One-way ANOVA with Tukey’s post hoc test (A); two-way ANOVA with Tukey’s post hoc test (D-F, I and K).
Article Snippet: Capture antibody of
Techniques: Enzyme-linked Immunosorbent Assay, Staining

Journal: bioRxiv
Article Title: Microglia at Sites of Atrophy Restrict the Progression of Retinal Degeneration via Galectin-3 and Trem2 Interactions
doi: 10.1101/2023.07.19.549403
Figure Lengend Snippet: ( A ) Marker expression of all human clusters. hMG, human microglia; mo-MFs, monocyte-derived macrophages; pv-MFs: perivascular macrophages; mo-DCs, monocyte-derived dendritic cells; VSMC, vascular smooth muscle cells. ( B ) Distribution of clusters by neuroretina and RPE/choroid tissues. Cell number of clusters was normalized to the total counts per tissue. ( C ) Pathway enrichment analysis of subretinal microglia with top 200 shared up-regulated genes. Top significant pathways sorted by false discovery and ranked by fold enrichment are shown. ( D ) UMAP plot showing integrated clustering analysis of three independent human AMD datasets. Data are shown with low resolution to reveal major cell types. ( E ) Dot plot showing the marker expression of major macrophage clusters. Cluster 3 is enriched with RHO expression. ( F ) UMAP plots showing the presence of hMG2 cluster in all three scRNA-seq datasets as indicated by arrows. ( G ) UMAP plots showing the enrichment of cluster 3 in donor 0106_nAMD. ( H ) UMAP plots showing clustering analysis with high resolution by each dataset and comparable heterogeneity of microglia (cluster 0, 7 and 12). As dataset GSE183320 does not contain neurosensory retina tissues, few cells of major homeostatic microglia (cluster 0) are observed in this dataset. ( I ) Violin plots showing the expression of LGALS3 , TREM2 and CD68 by microglial clusters between non-AMD and AMD donors. Both cluster 7 and 12 show LGALS3 upregulation as hMG2 cluster identified in this study. ( J and K ) Quantifications of LGALS3 + microglial clusters (7 and 12) in the macular and whole RPE/choroid tissues between non-AMD and AMD donors. Data were from three independent datasets and compared using Mann-Whitney test. P-values are shown. ns: not significant.
Article Snippet: Capture antibody of
Techniques: Marker, Expressing, Derivative Assay, MANN-WHITNEY

Journal: bioRxiv
Article Title: Microglia at Sites of Atrophy Restrict the Progression of Retinal Degeneration via Galectin-3 and Trem2 Interactions
doi: 10.1101/2023.07.19.549403
Figure Lengend Snippet: ( A ) Multispectral imaging of GAL3 and CD68 co-staining in the subretinal space (top) and inner retina (bottom) from human donors. Unmixed purple spectrum (GAL3) and yellow spectrum (CD68) are shown. The areas of colocalized spectra are highlighted in green. Scale bar: 50μm. ONL and INL, outer and inner nuclear layers. ( B ) Representative image of Gal3 and CD68 co-staining in the macular GA region of a retinal section from an 88-year-old female donor eye with advanced AMD (Sarks V). Black insert box shows the magnification of GA with double positive cells. Scale bar: 200μm. ONL and INL, outer and inner nuclear layers; GCL, ganglion cell layer. ( C ) Correlation between the frequencies of macular Gal3 + CD68 + double positive cells (y axis) and Sarks AMD grading (x axis) by Spearman’s correlation (n = 18 donors, Table S2). Coefficient and p-value are shown. ( D ) Histograms showing increased TREM2 + myeloid cells (CD45 + CD11B + ) in RPE/choroid tissues of AMD donors. Concatenated histograms were shown (n=3 per groups). Control human blood samples were used to set up flow gating. ( E-G ) Quantifications of TREM2 + (E), CD45 + (F), and CD11B + (G) cell frequencies in RPE/choroid tissues between non-AMD and AMD donors. Unpaired Student’s t test is used. P-values are shown. ( H ) Correlation between the frequencies of TREM2 + myeloid cells (y axis) and Sarks AMD grading (x axis) in RPE/choroid tissues by Spearman’s correlation. Coefficient and p-value are shown.
Article Snippet: Capture antibody of
Techniques: Imaging, Staining

Journal: bioRxiv
Article Title: Microglia at Sites of Atrophy Restrict the Progression of Retinal Degeneration via Galectin-3 and Trem2 Interactions
doi: 10.1101/2023.07.19.549403
Figure Lengend Snippet: ( A ) Images of GAL3 (purple) and CD68 (yellow) co-staining in the macula region of retinal sections from human donors categorized by Sark grades (I-VI). The macular neurosensory retinas of some subject eyes exhibited fixation-related artifactual detachment. In these subjects, separate images of RPE/choroid tissues are shown. Scale bar: 100μm. ONL and INL, outer and inner nuclear layers. GCL, ganglion cell layer. ( B ) Spectral imaging of GAL3 and CD68 co-staining in the geographic atrophy from donor #23 with advanced AMD (Sarks V). Unmixed purple spectrum (GAL3) and yellow spectrum (CD68) are shown. The areas of colocalized spectra are highlighted in green. Scale bar: 50μm. ( C and D ) Images showing the presence of subretinal GAL3 (purple) and CD68 (yellow) double positive cells in the areas with photoreceptor loss and preserved RPE in the transitional area of the macula from an AMD donor (C) and in the age-related peripheral degeneration of a non-AMD donor (D). Scale bars: 100μm. ( E ) Gating strategy of flow cytometry analysis. CD45 + CD11B + cells and CD45 + CD11B - cells from control blood were used to determine the gating of TREM2 + cells. Concatenated plots are shown for non-AMD and AMD. ( F ) Flow contour plots of individual donors showing increased percentage of TREM2 + myeloid cells in AMD.
Article Snippet: Capture antibody of
Techniques: Staining, Imaging, Flow Cytometry